This page presents different screenshots related to Agileto software tool.

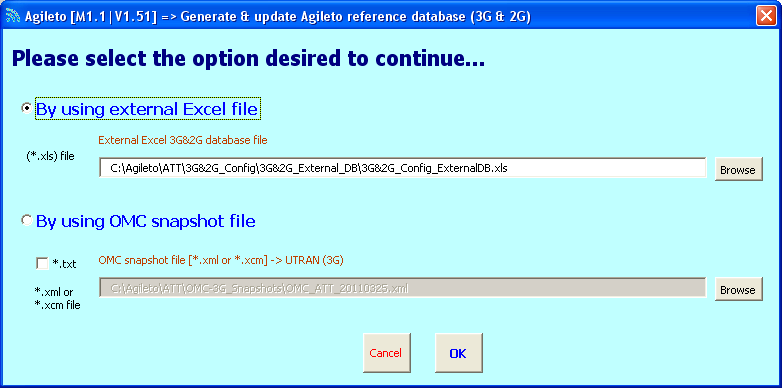
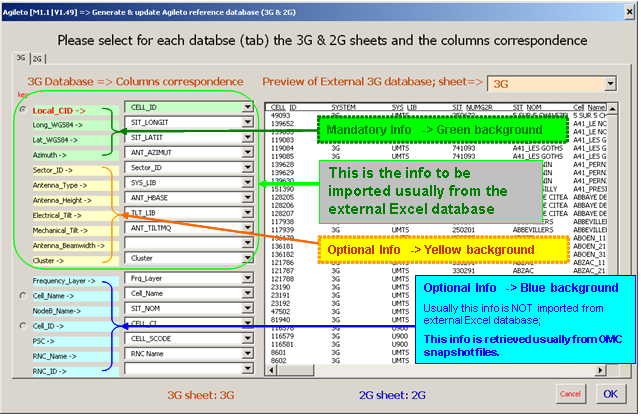
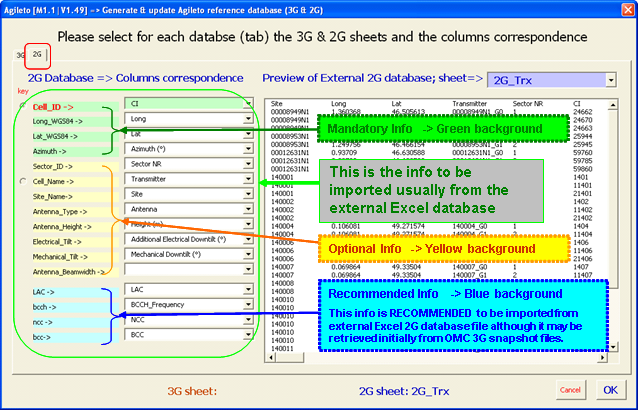
1.1) Generate and update Agileto reference database (3G & 2G)
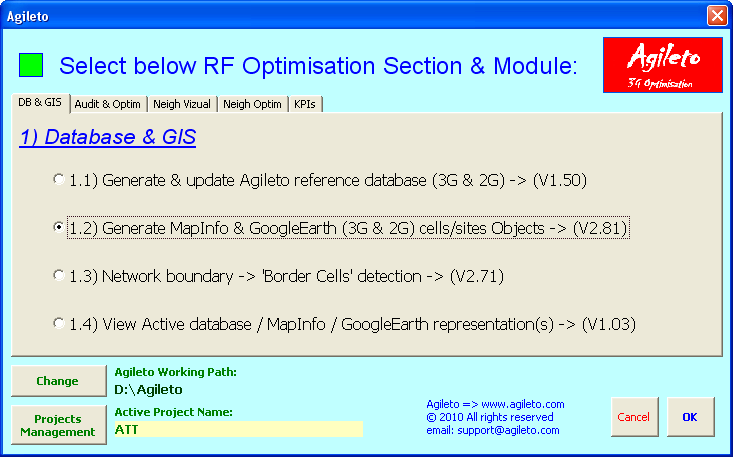
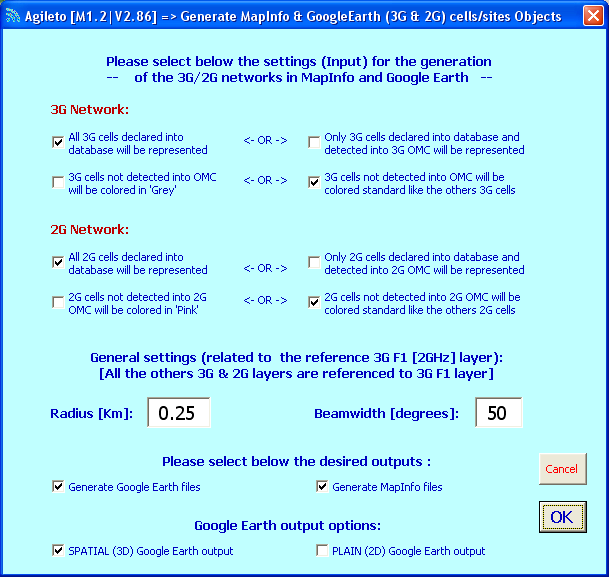
1.2) Generate MapInfo & GoogleEarth (3G & 2G) cells/sites objects
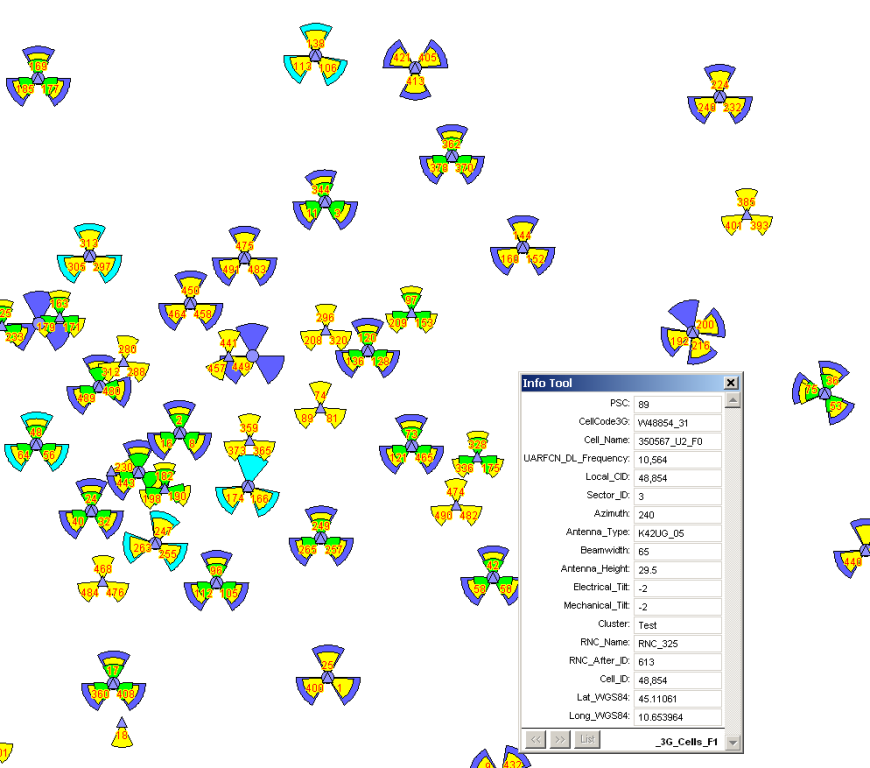
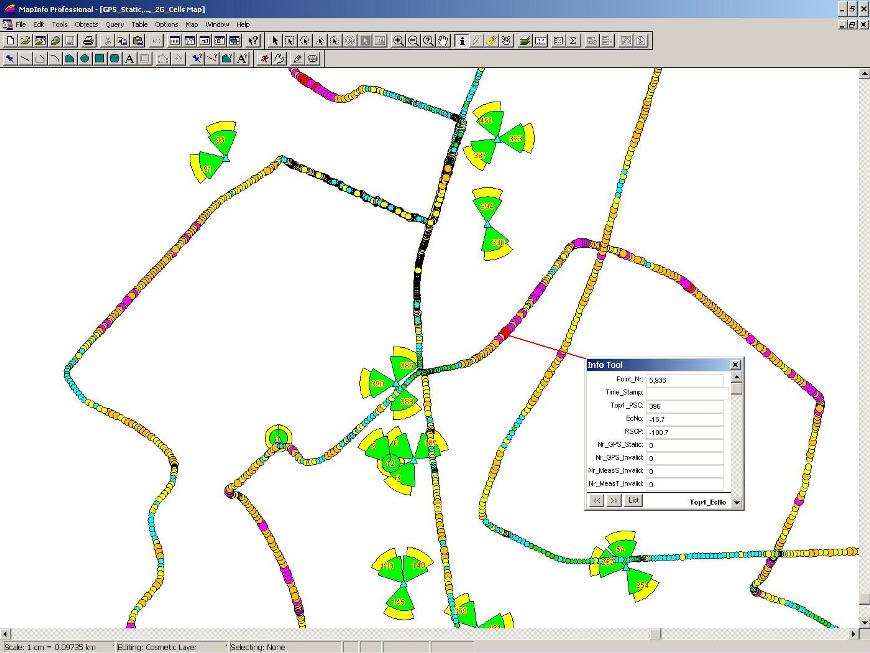
MapInfo General overview:
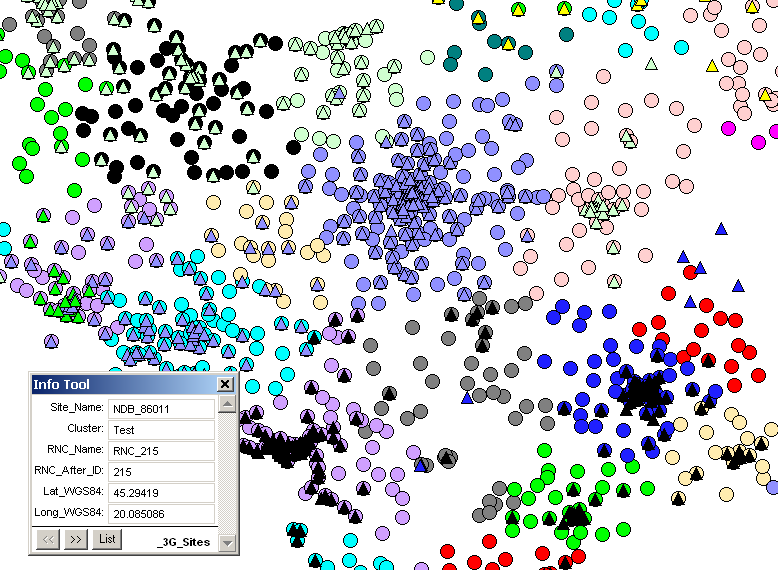
MapInfo Detailed view:
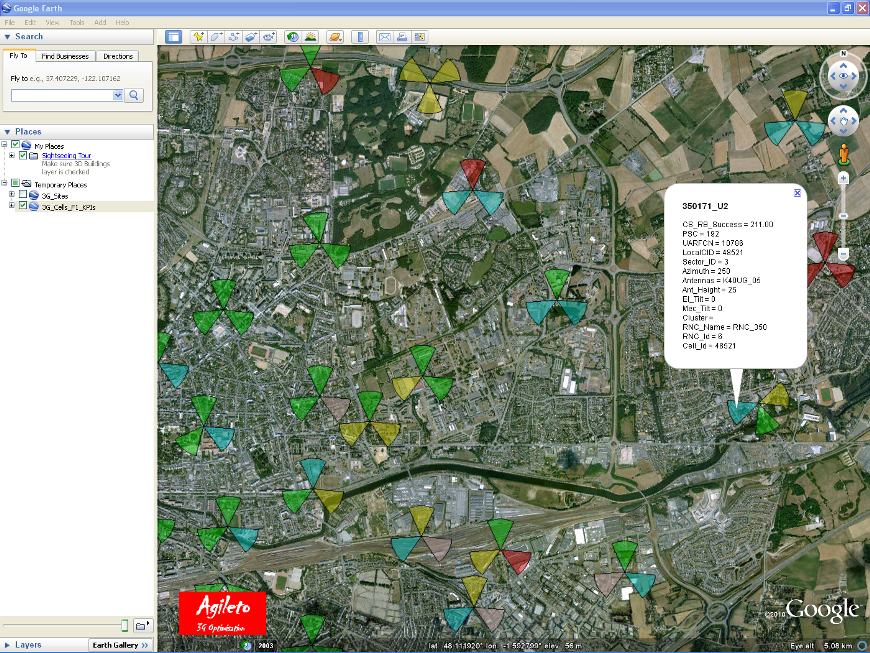
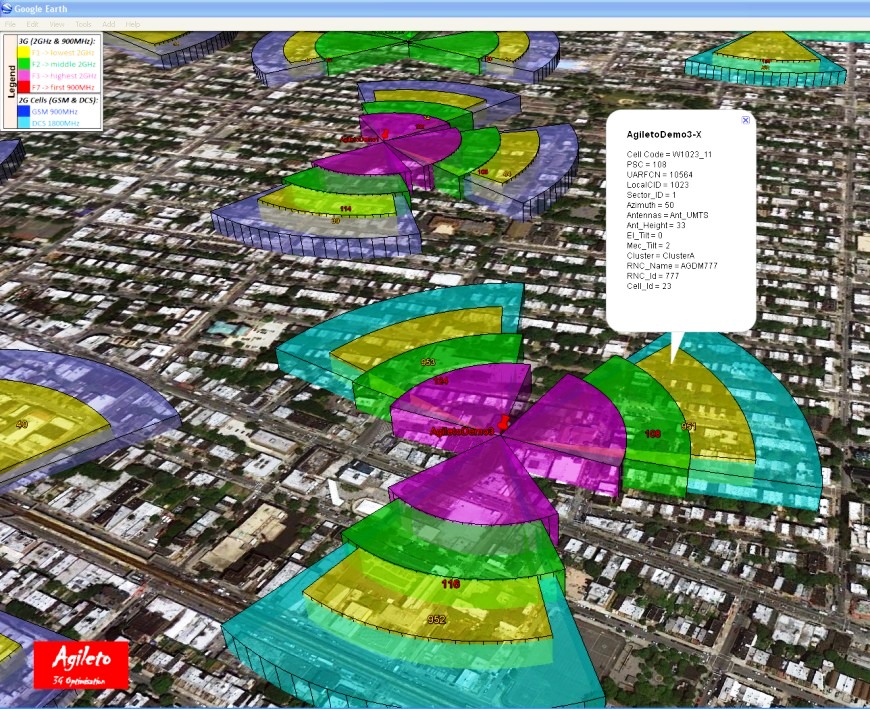
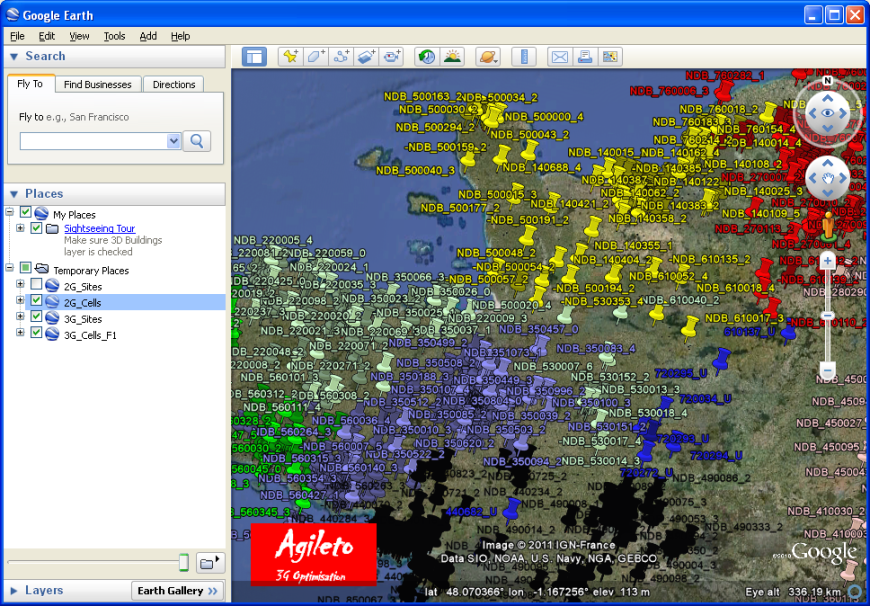
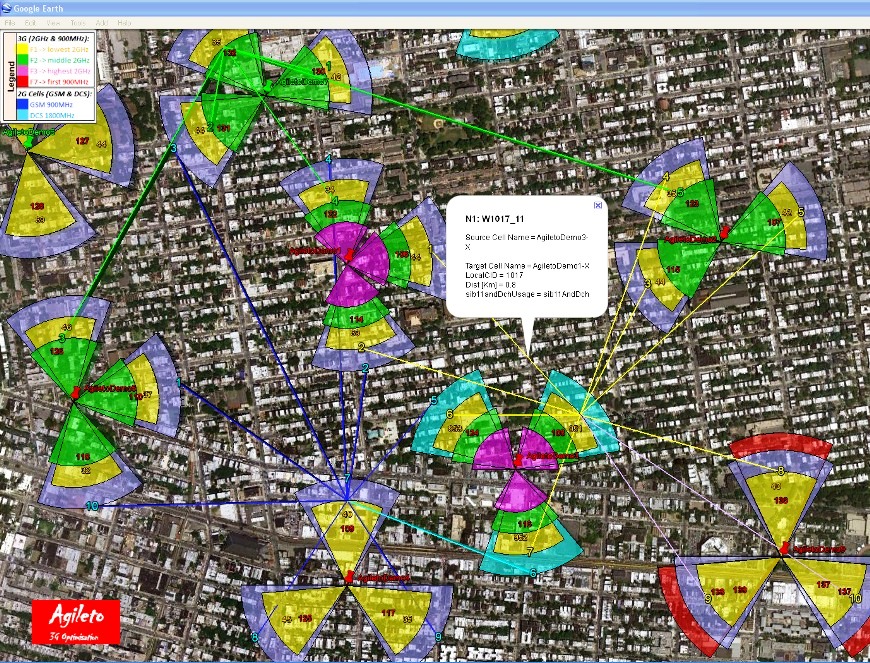
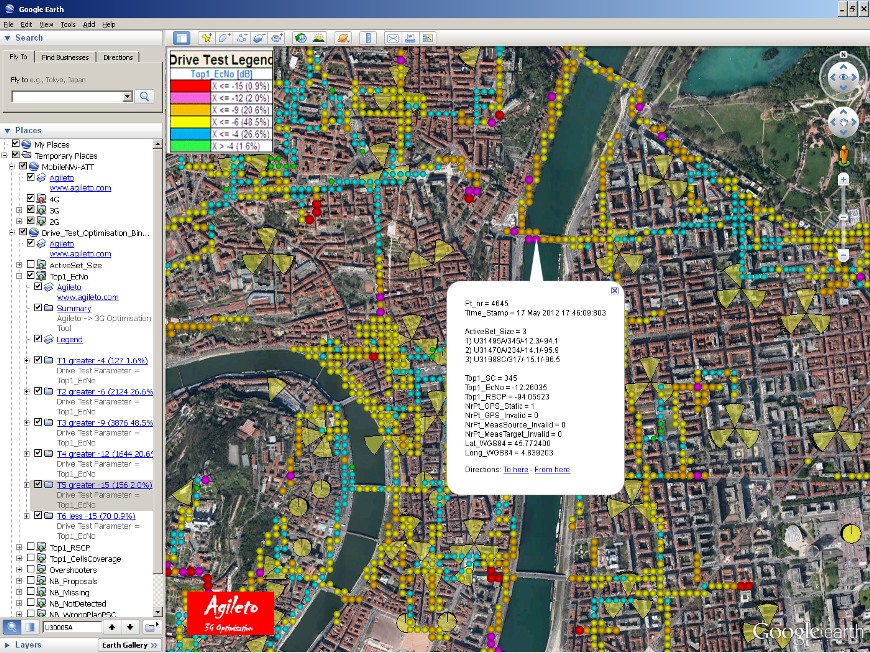
GoogleEarth General overview:
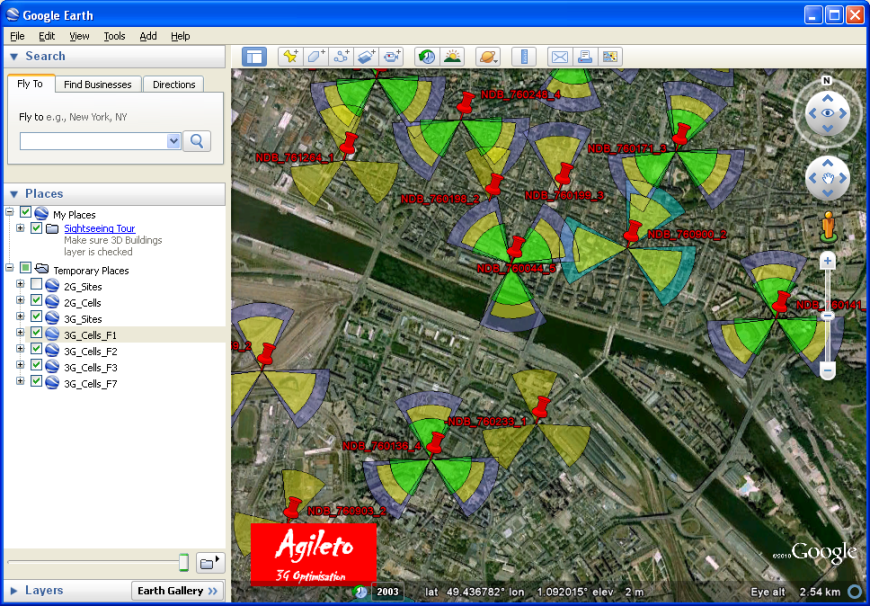
GoogleEarth Detailed view:
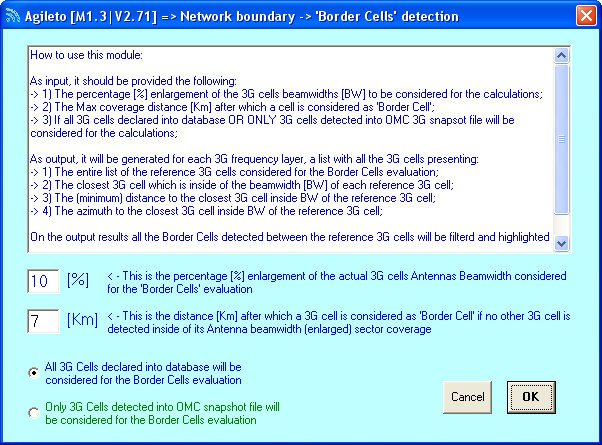
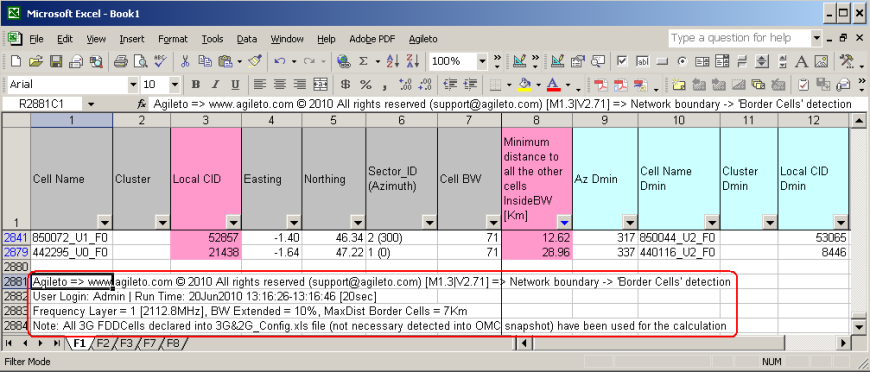
1.3) Network boundary: ‘Border Cells’ detection
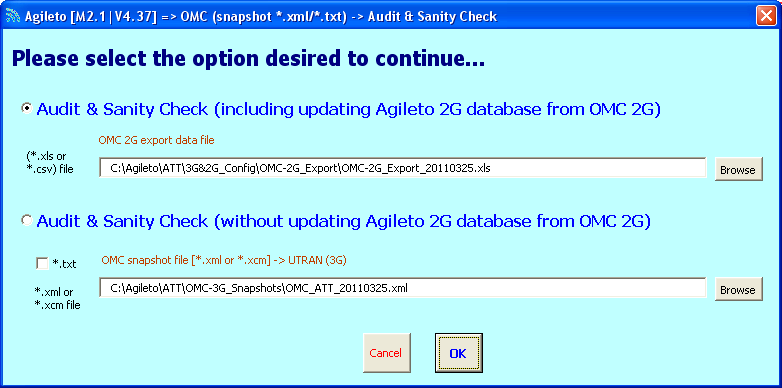
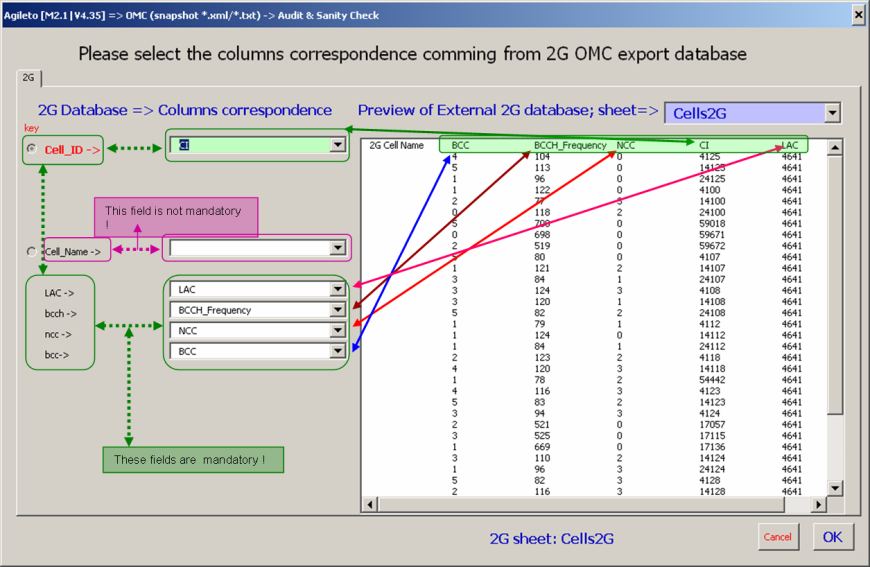
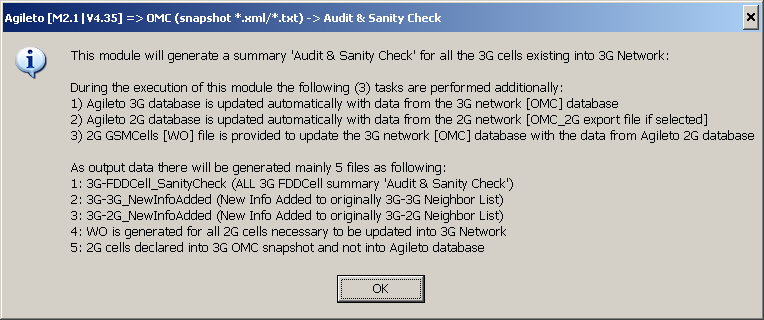
2.1) OMC (snapshot *.xml/*.txt): Audit and sanity check
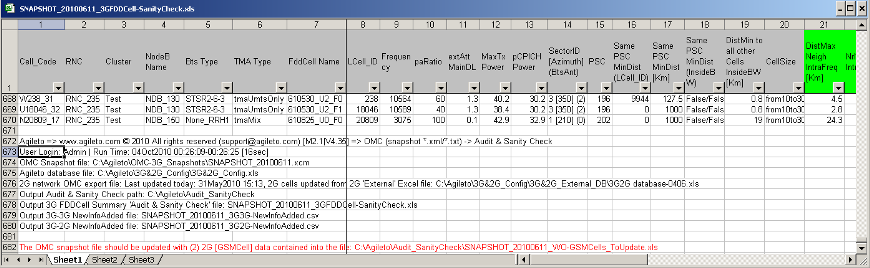
3GFDDCell-SanityCheck Report (1):
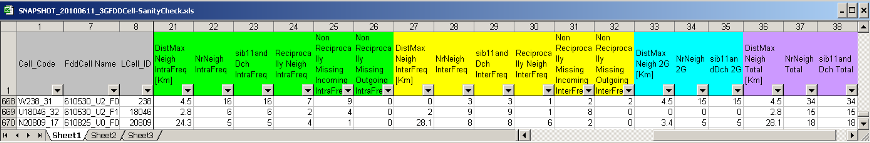
3GFDDCell-SanityCheck Report (2):
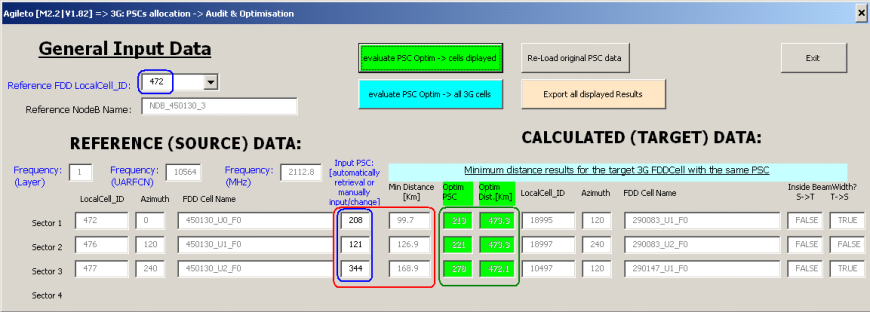
2.2) 3G: PSC allocation: Audit and Optimization
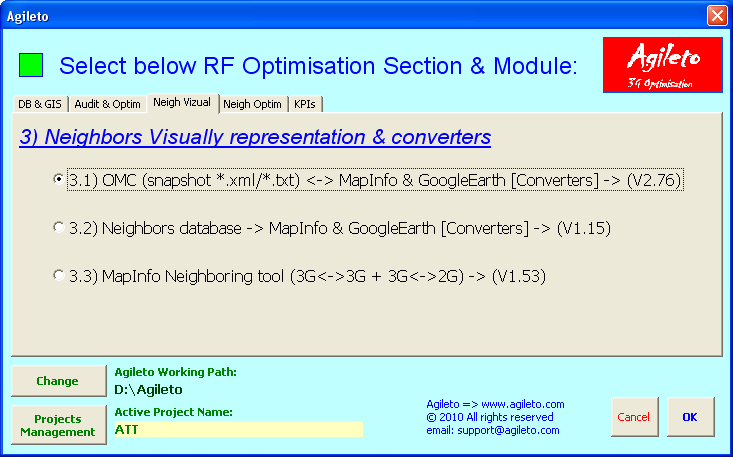
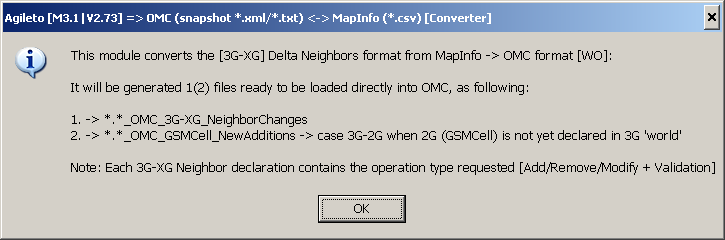
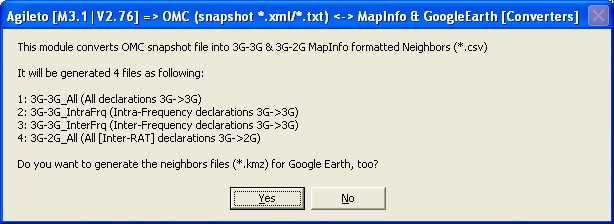
3.1) OMC (snapshot *.xml/*.txt) <-> MapInfo (*.csv) and Google Earth (*.kmz) converters

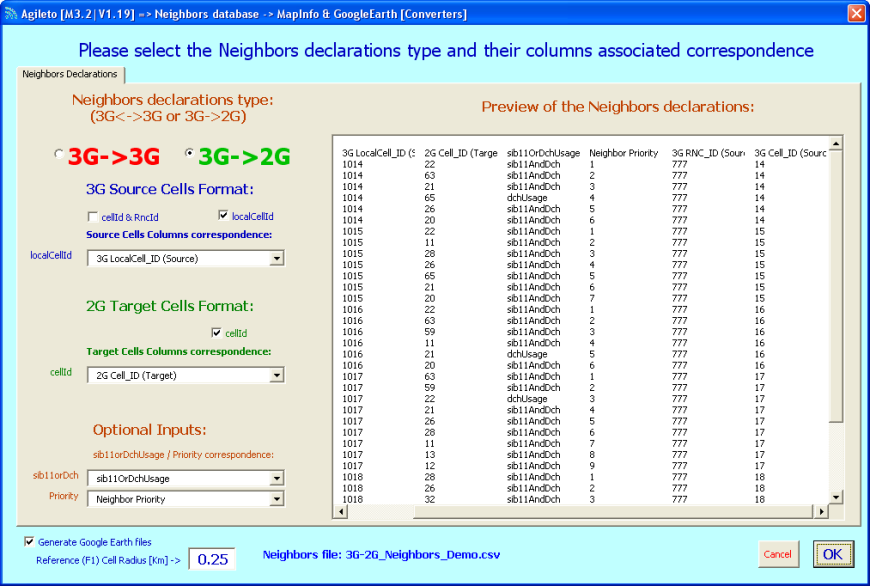
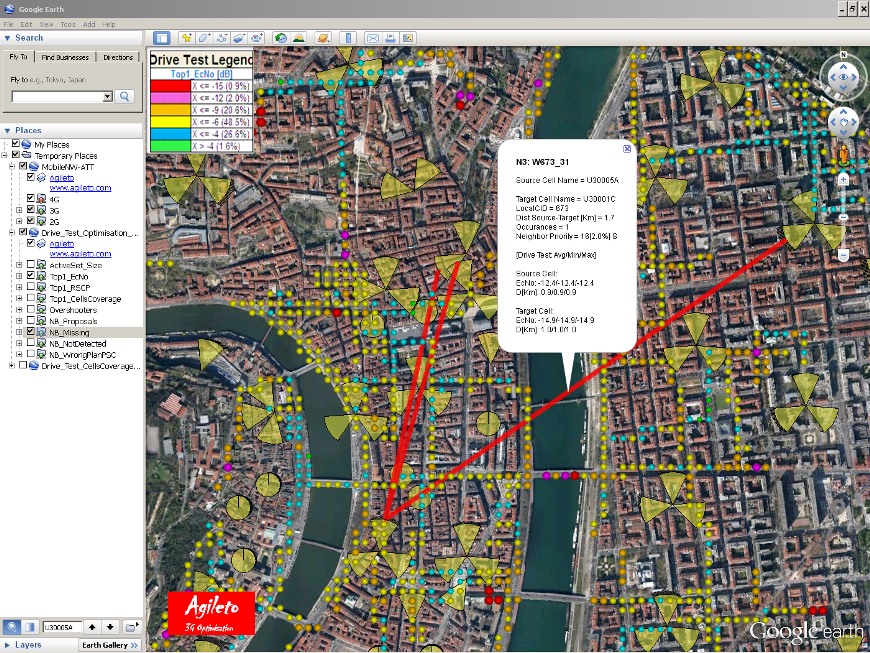
3.2) Neighbors database -> MapInfo (*.csv) and Google Earth (*.kmz) converters
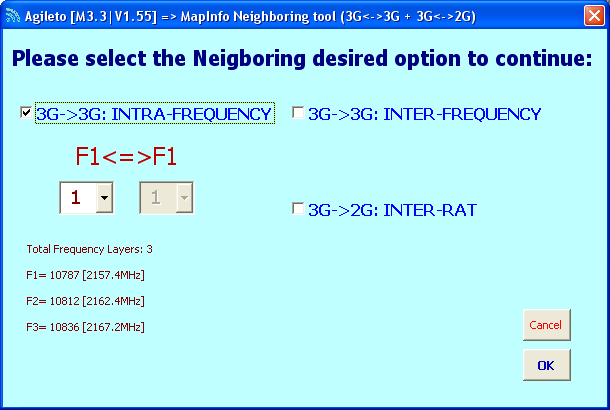
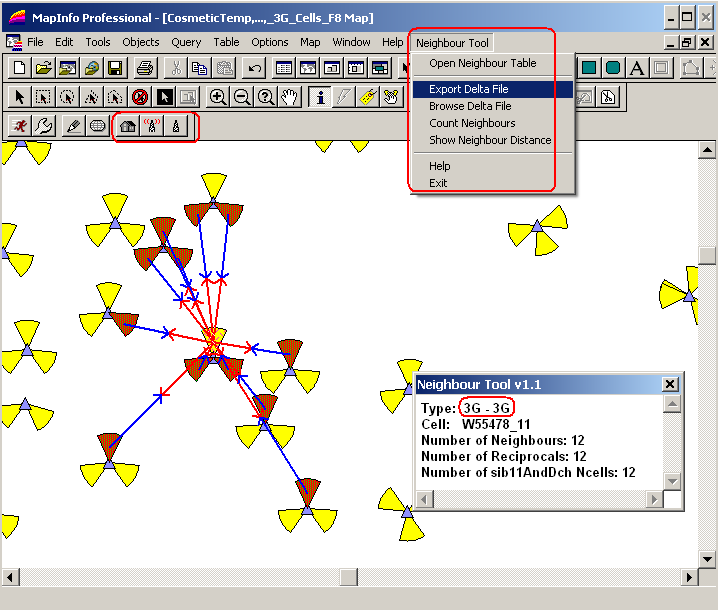
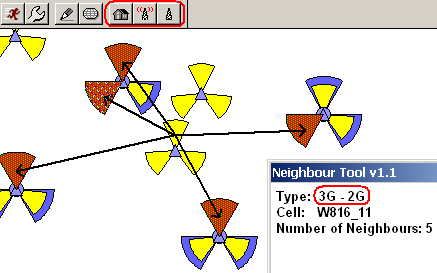
3.3) MapInfo Neighboring tool (3G <–> 3G + 3G <–> 2G)
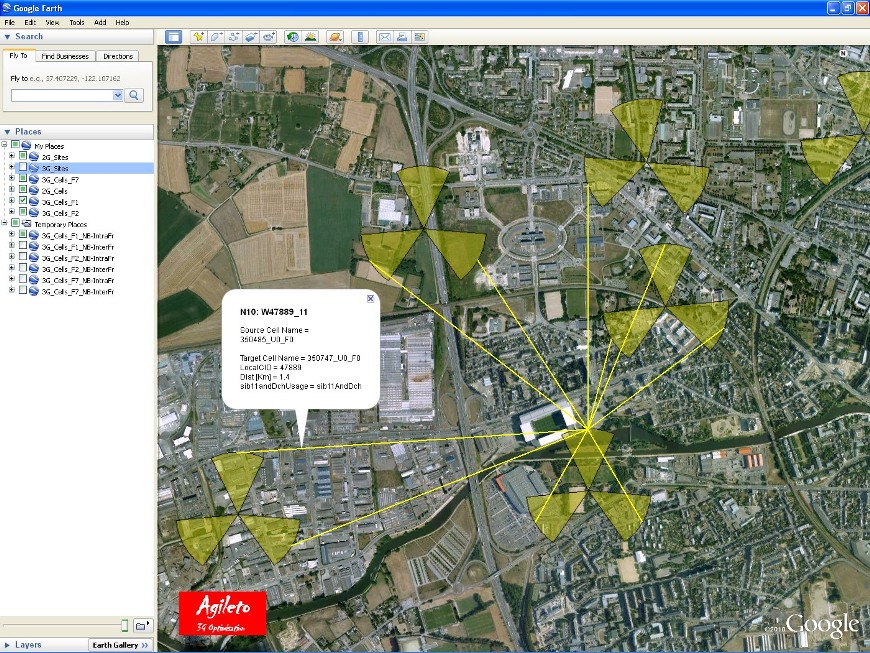
Example of case 3G->3G:
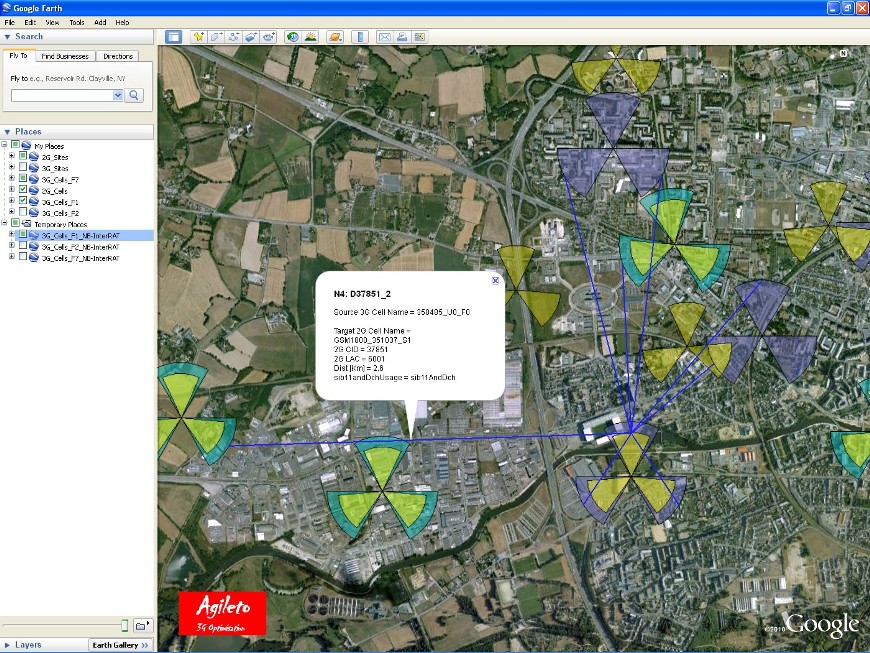
Example of case 3G->2G:
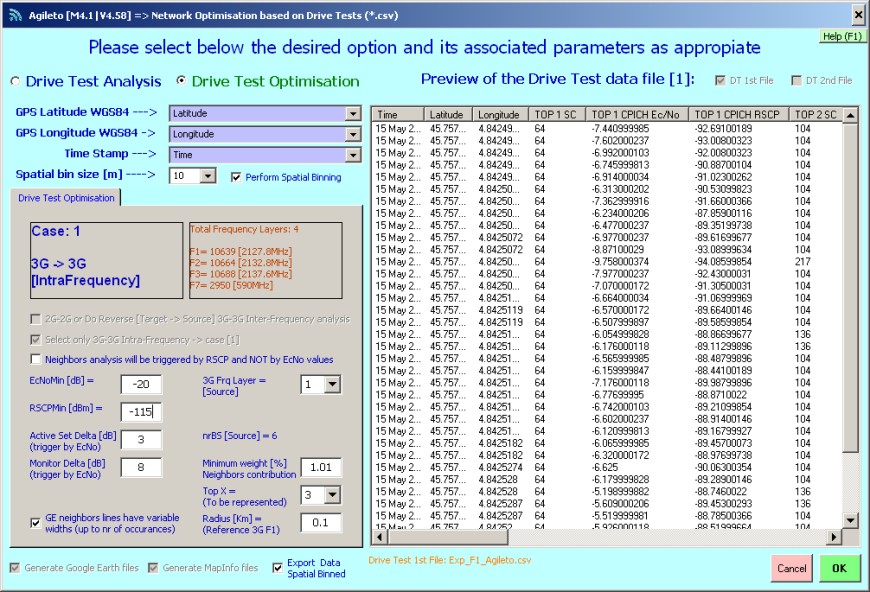
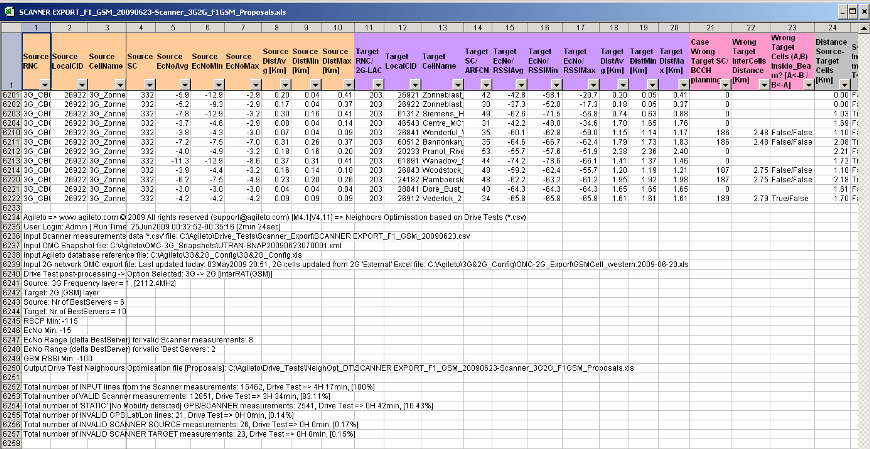
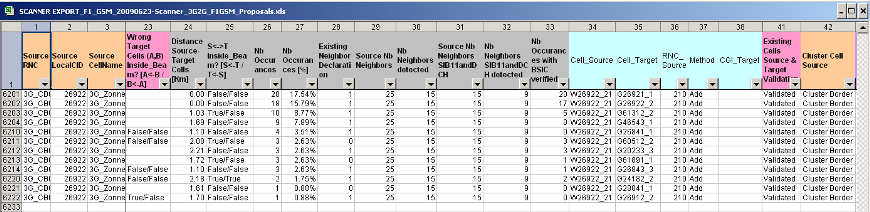
4.1) Neighbors Optimisation based on Drive Tests


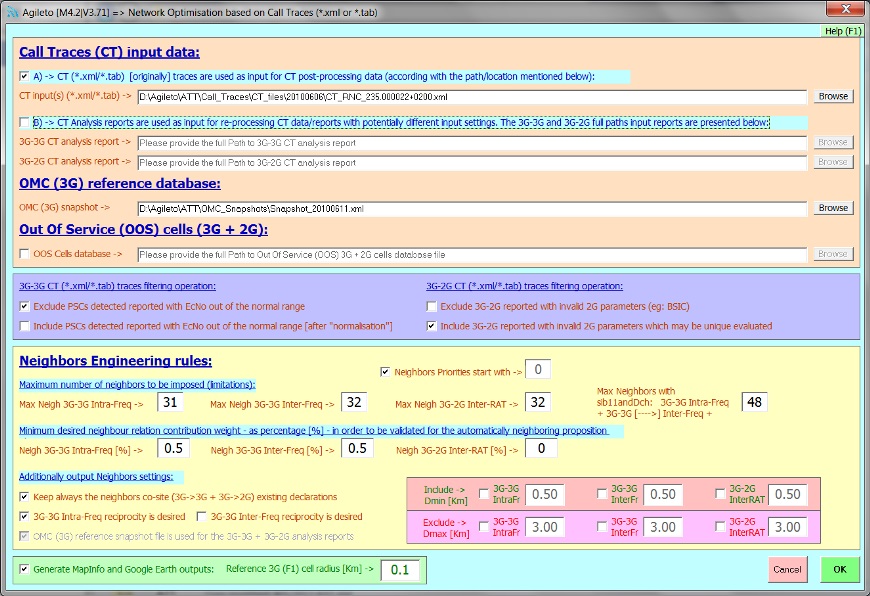
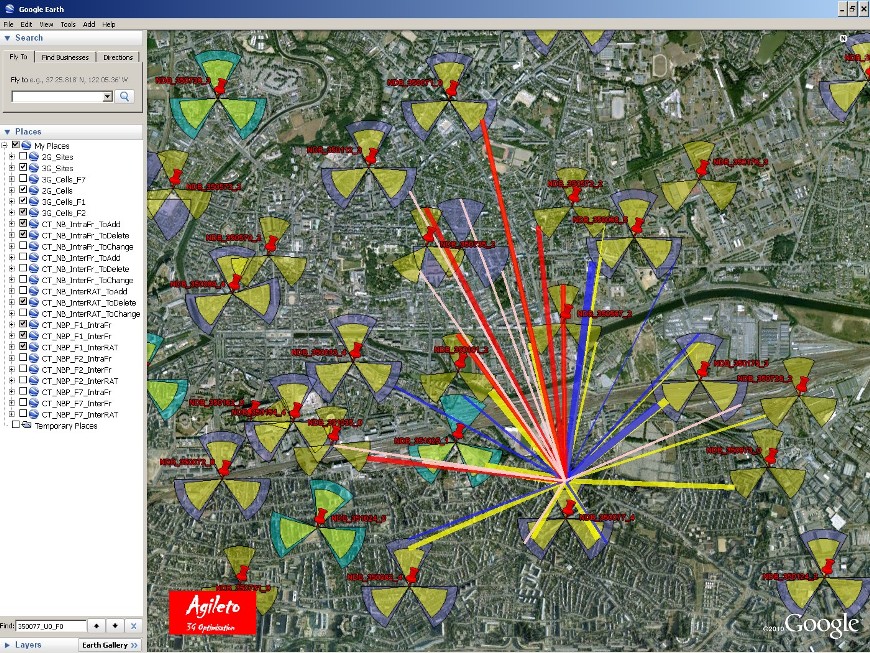
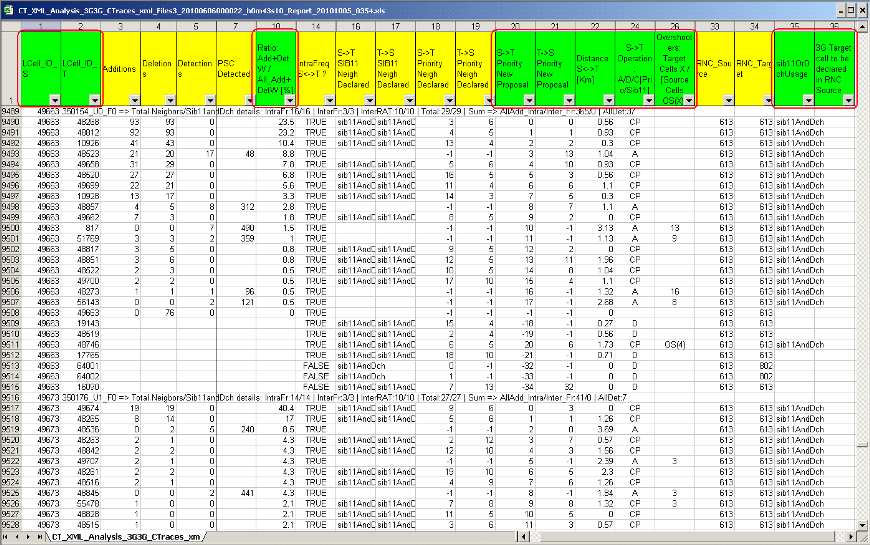
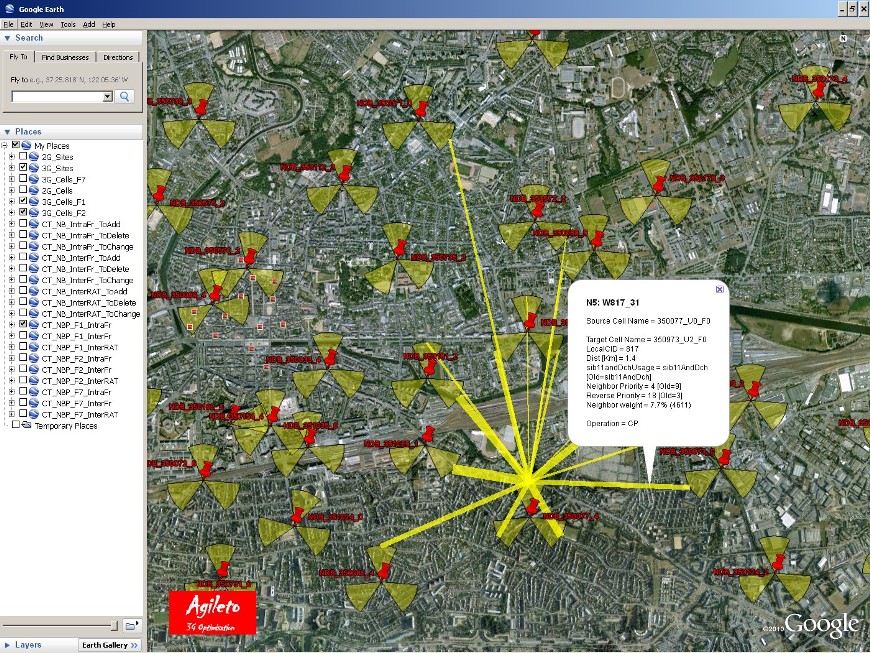
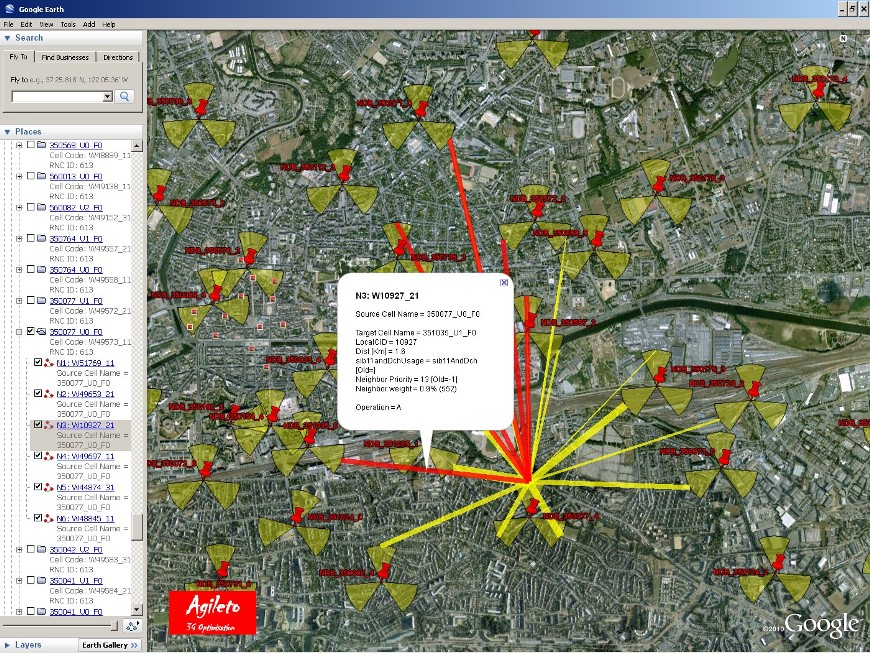
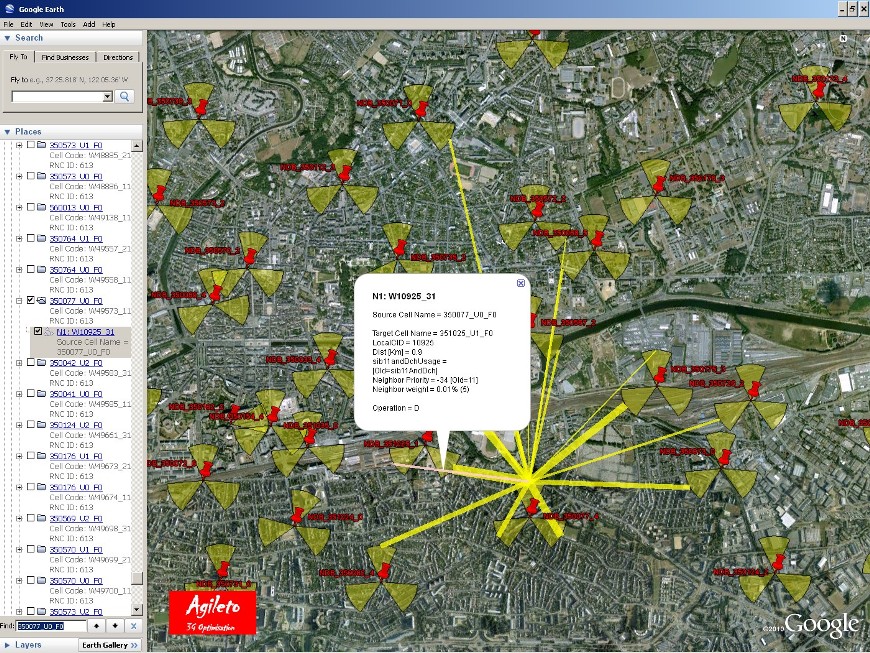
4.2) Neighbors Optimisation based on Call Traces
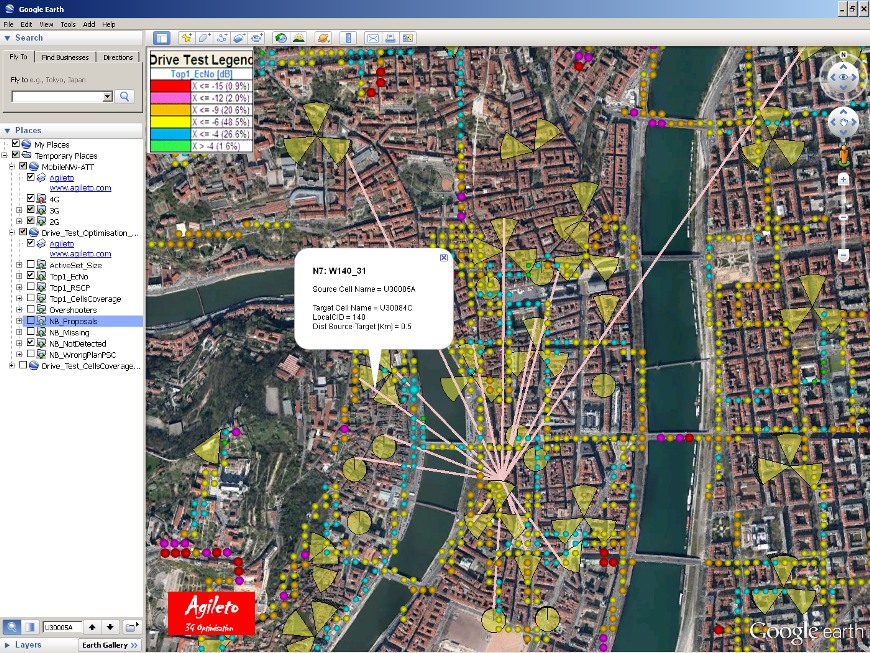
Example of 3G-3G Call Trace Neighbors Optimisation analysis report:
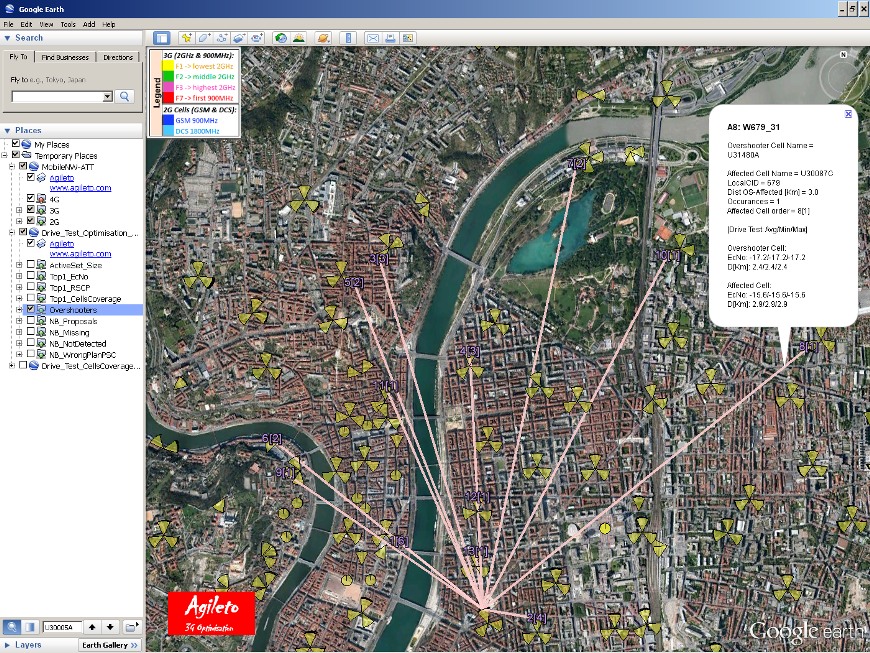
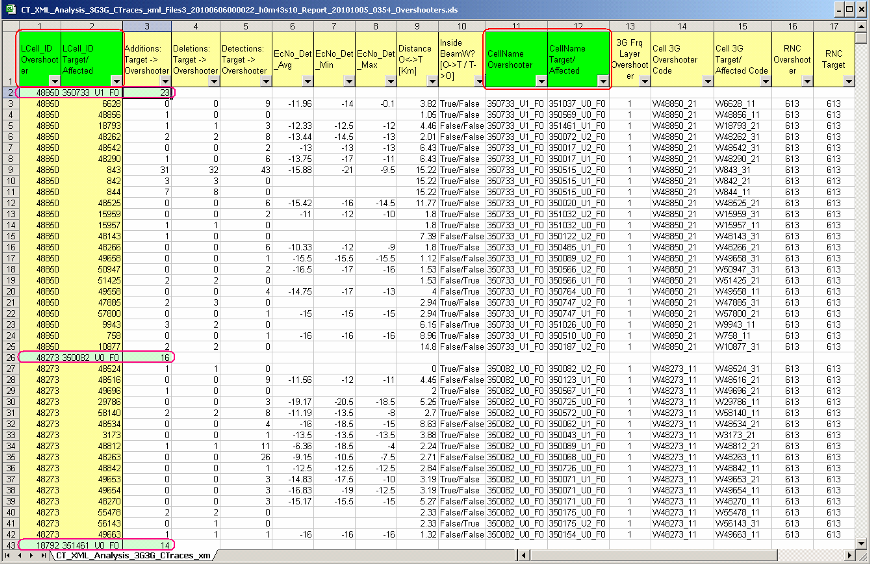
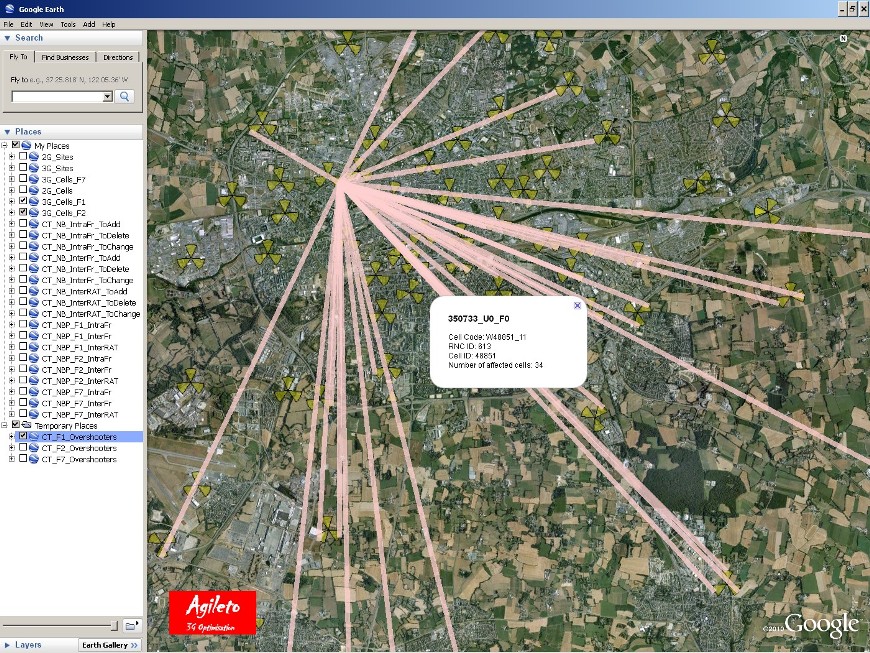
Example of 3G Call Trace analysis Over-Shooters report:
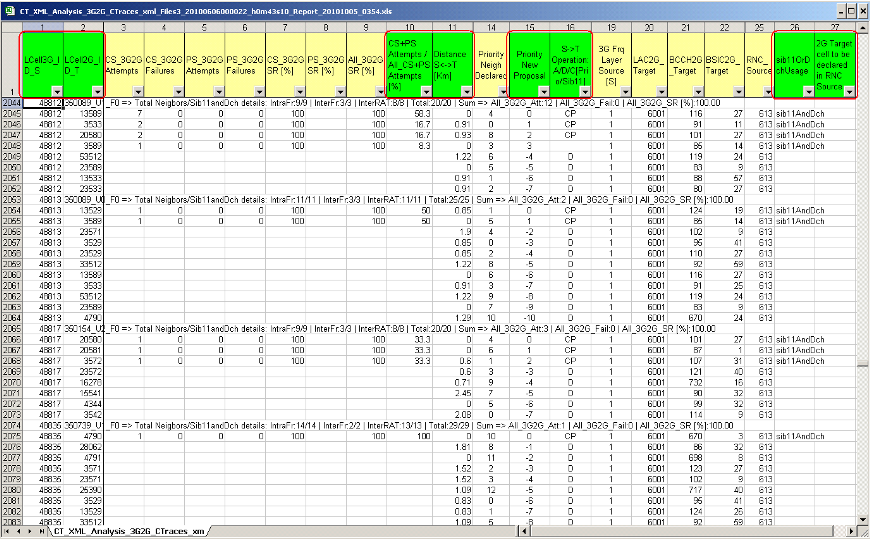
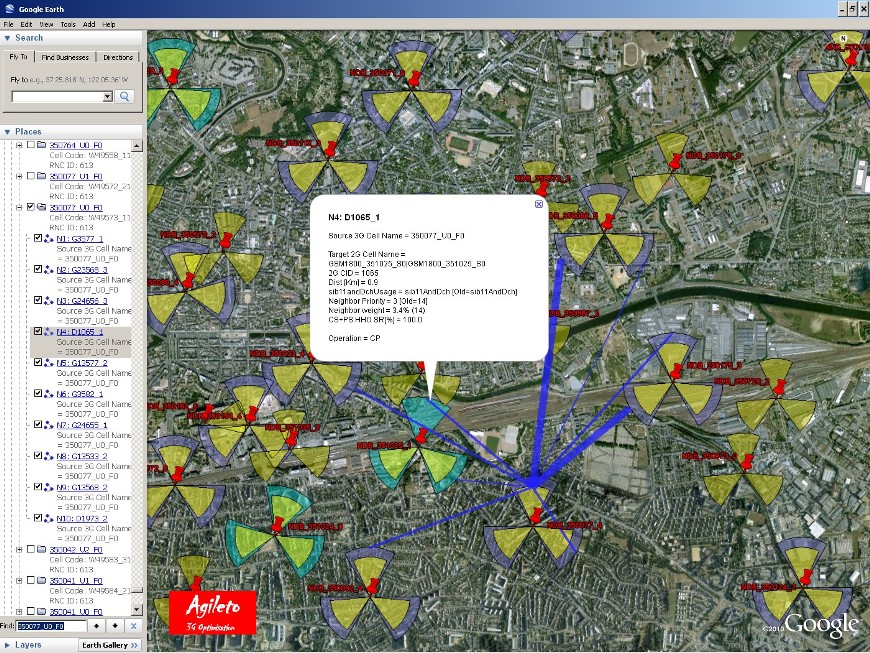
Example of 3G-2G Call Trace Neighbors Optimisation analysis report:

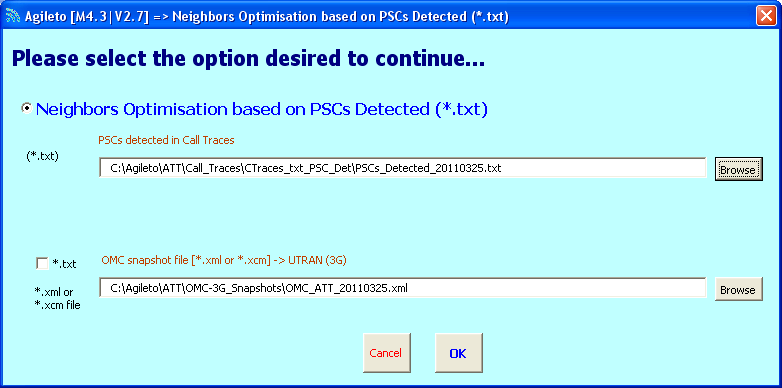
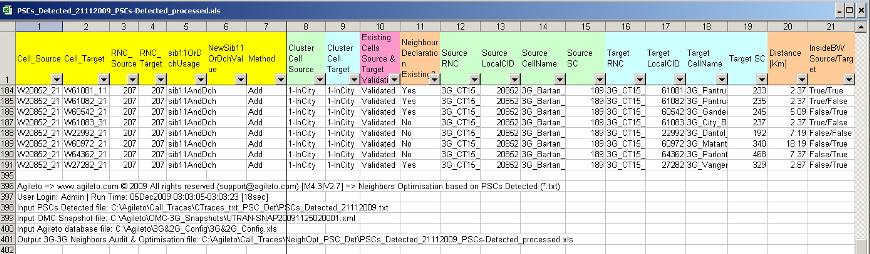
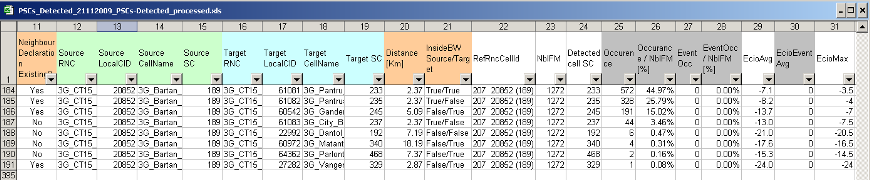
4.3) Neighbors Optimisation based on PSCs Detected
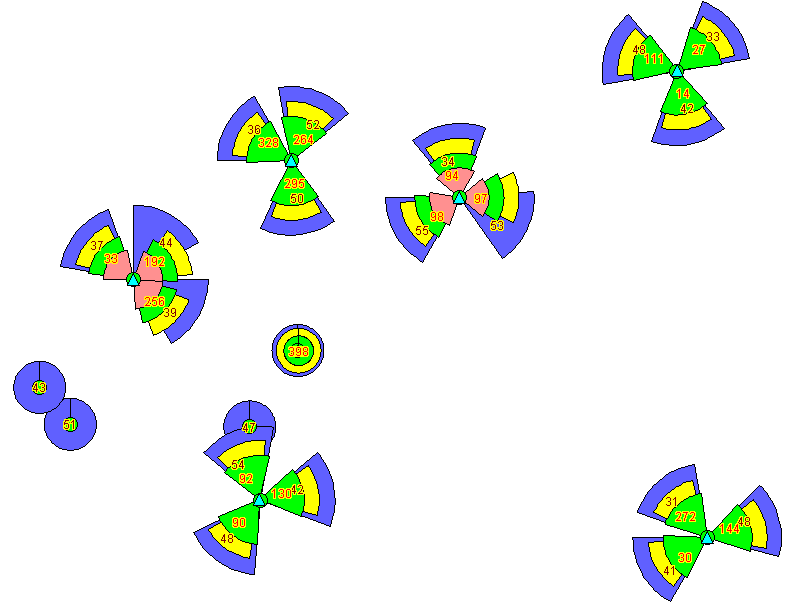
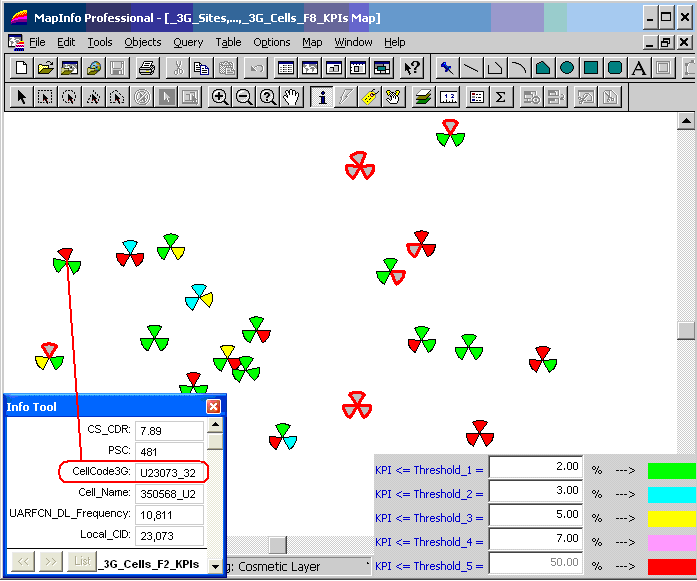
5.1) Generate MapInfo & GoogleEarth cells/sites objects based on KPIs values
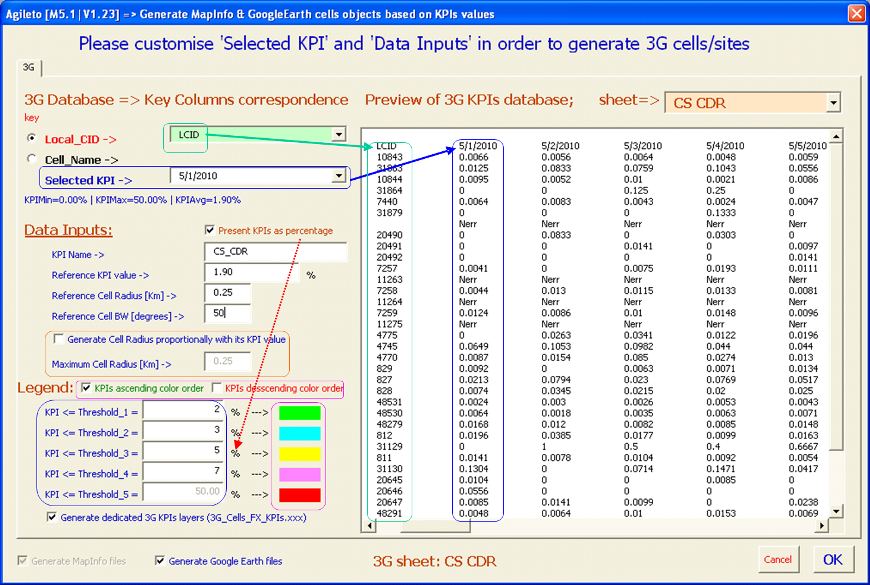
A) Below it is an example of KPI => CS_CDR [%] when the 3G Cells radius are constant but their colors are proportionally dependent on their CDR values:
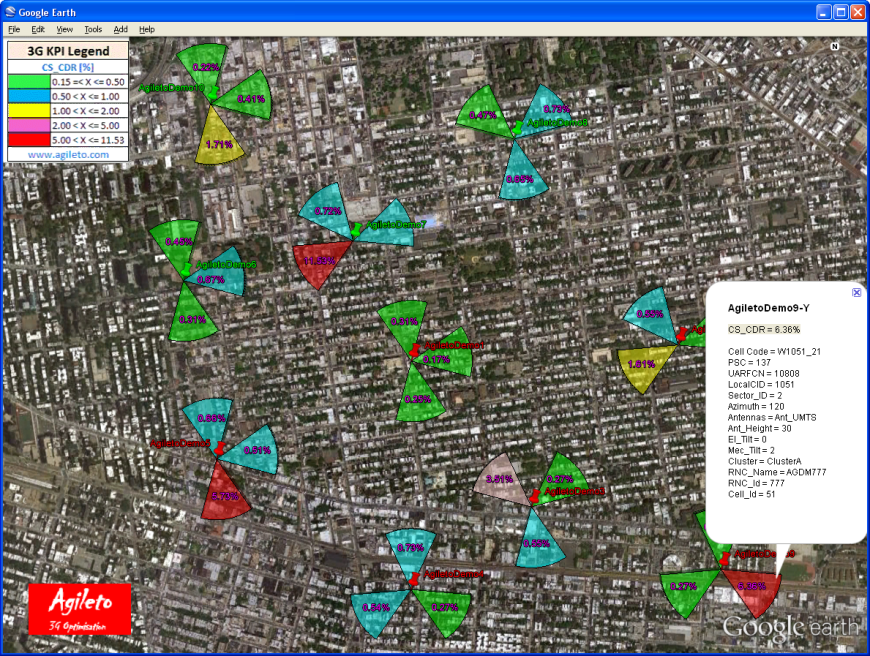
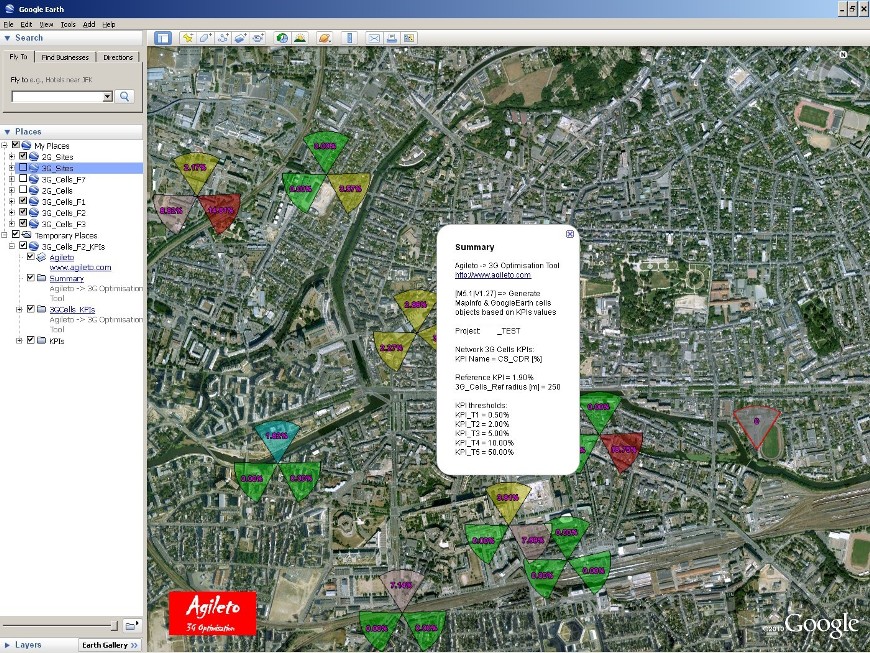
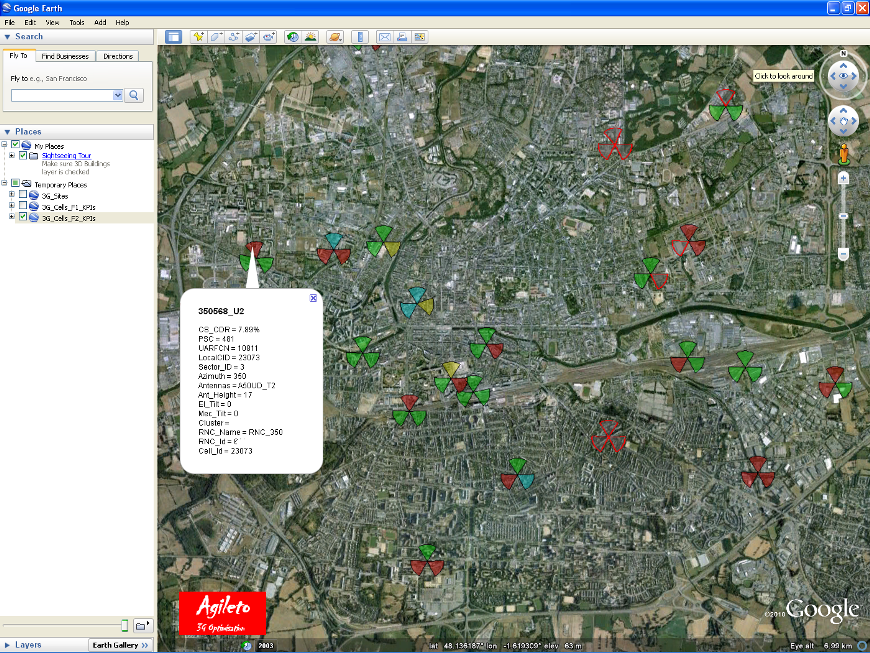
The picture below is the same example as above represented in Google Earth:
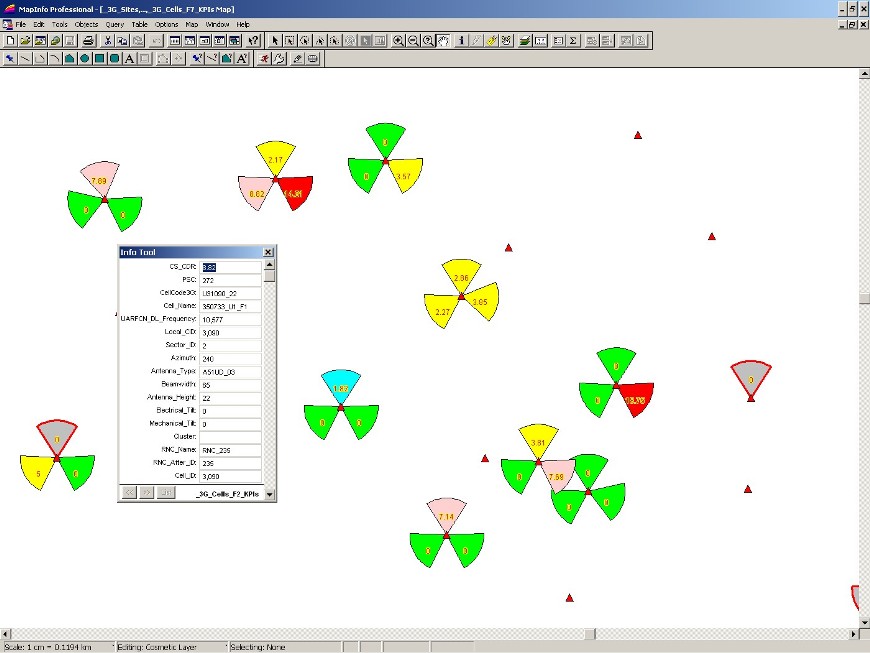
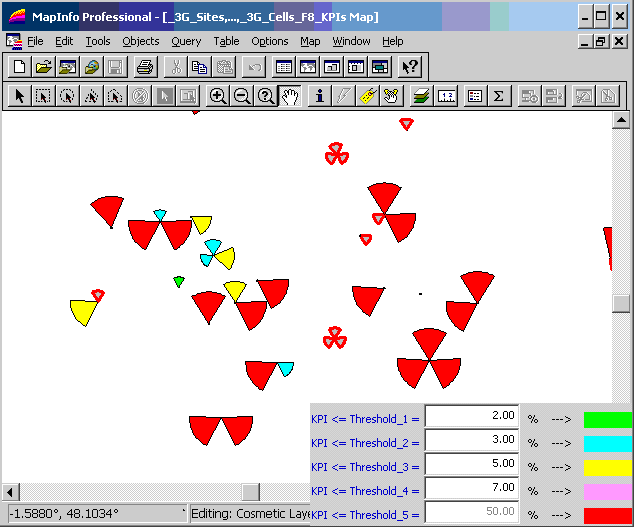
Below it is presented in MapInfo the same area presenting CS_CDR [%] when the 3G Cells have both radius and their colors proportionally dependent on their CDR values:
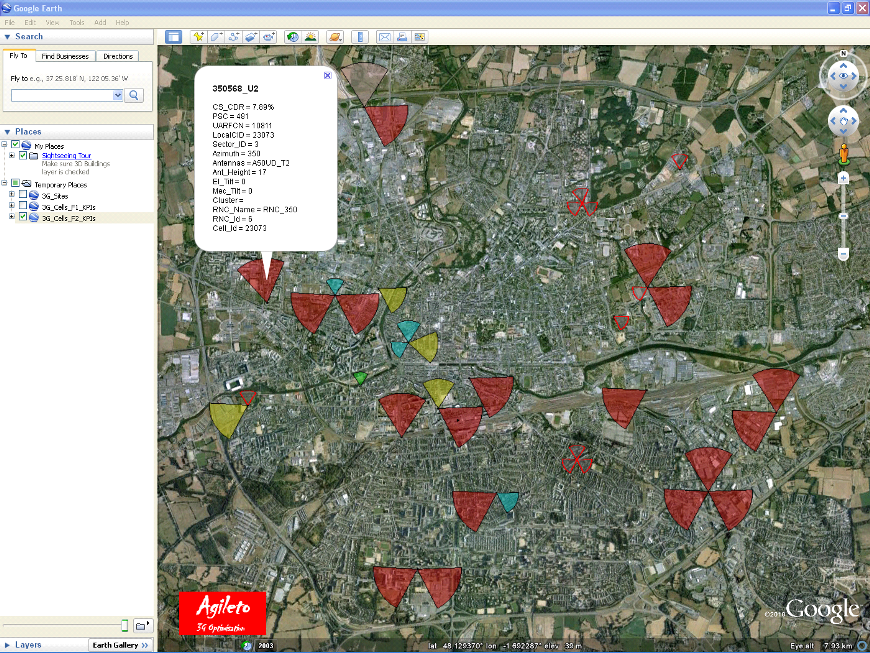
The picture below is the same example as above represented in Google Earth:
B) Example of one case when the KPI is CS_RB_Setup_Success -> (KPI is expressed generally as a number)
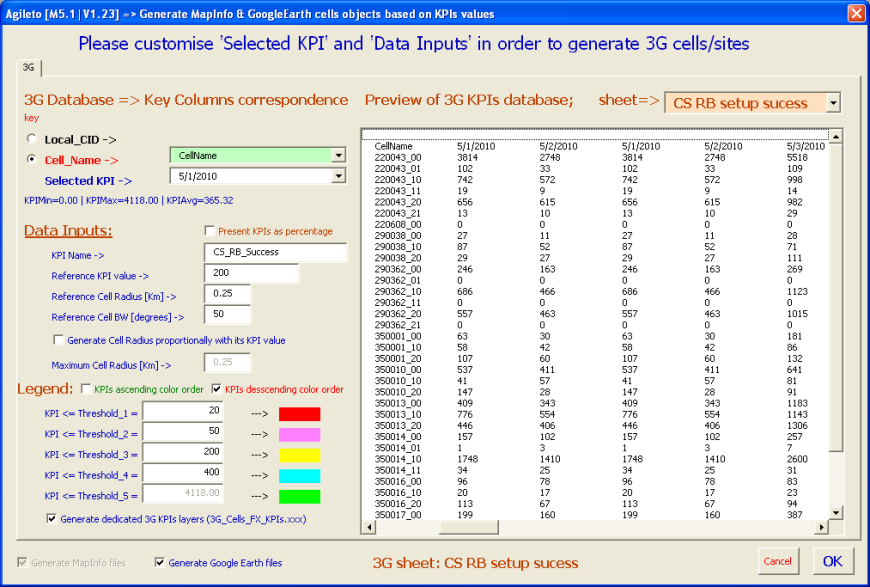
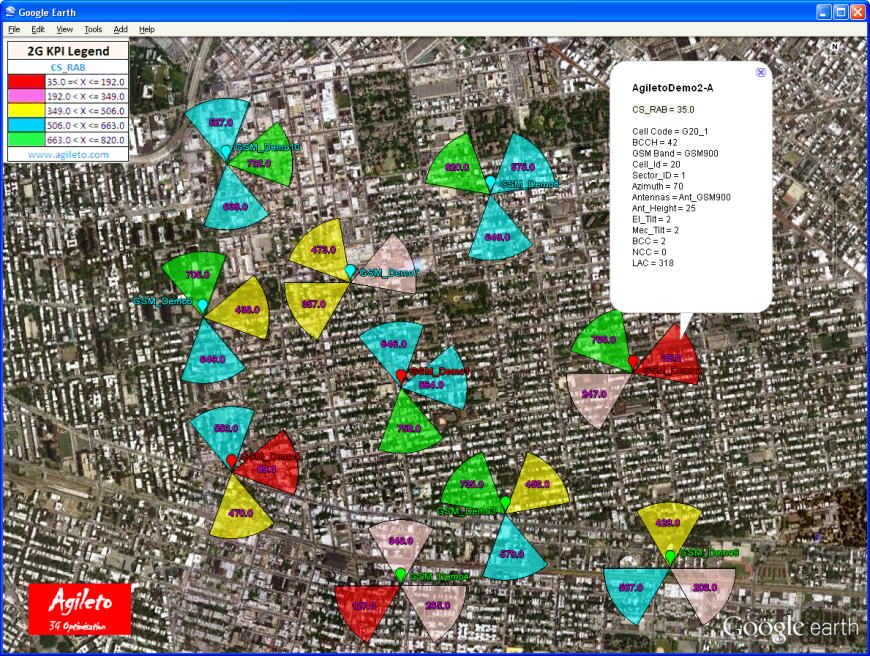
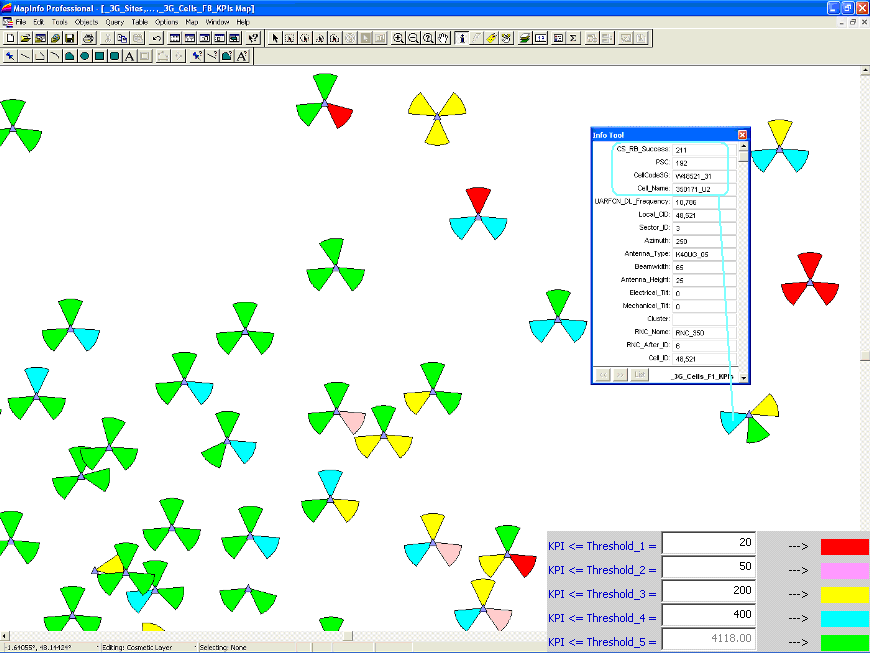
Below is represented the case B (KPI is CS_RB_Setup_Success) => Cells colors up to their KPIs values & cells radius are constant!
The picture below is the same example as above represented in Google Earth: